I am thrilled to announce the release of my latest project: PyMIHCharts.
As someone passionate about both software engineering and financial markets, I wanted to build a tool that bridges the gap between raw data and actionable insight. While there are many charting libraries out there, I needed something that offered native performance and deep customization for advanced indicators.
What is PyMIHCharts?
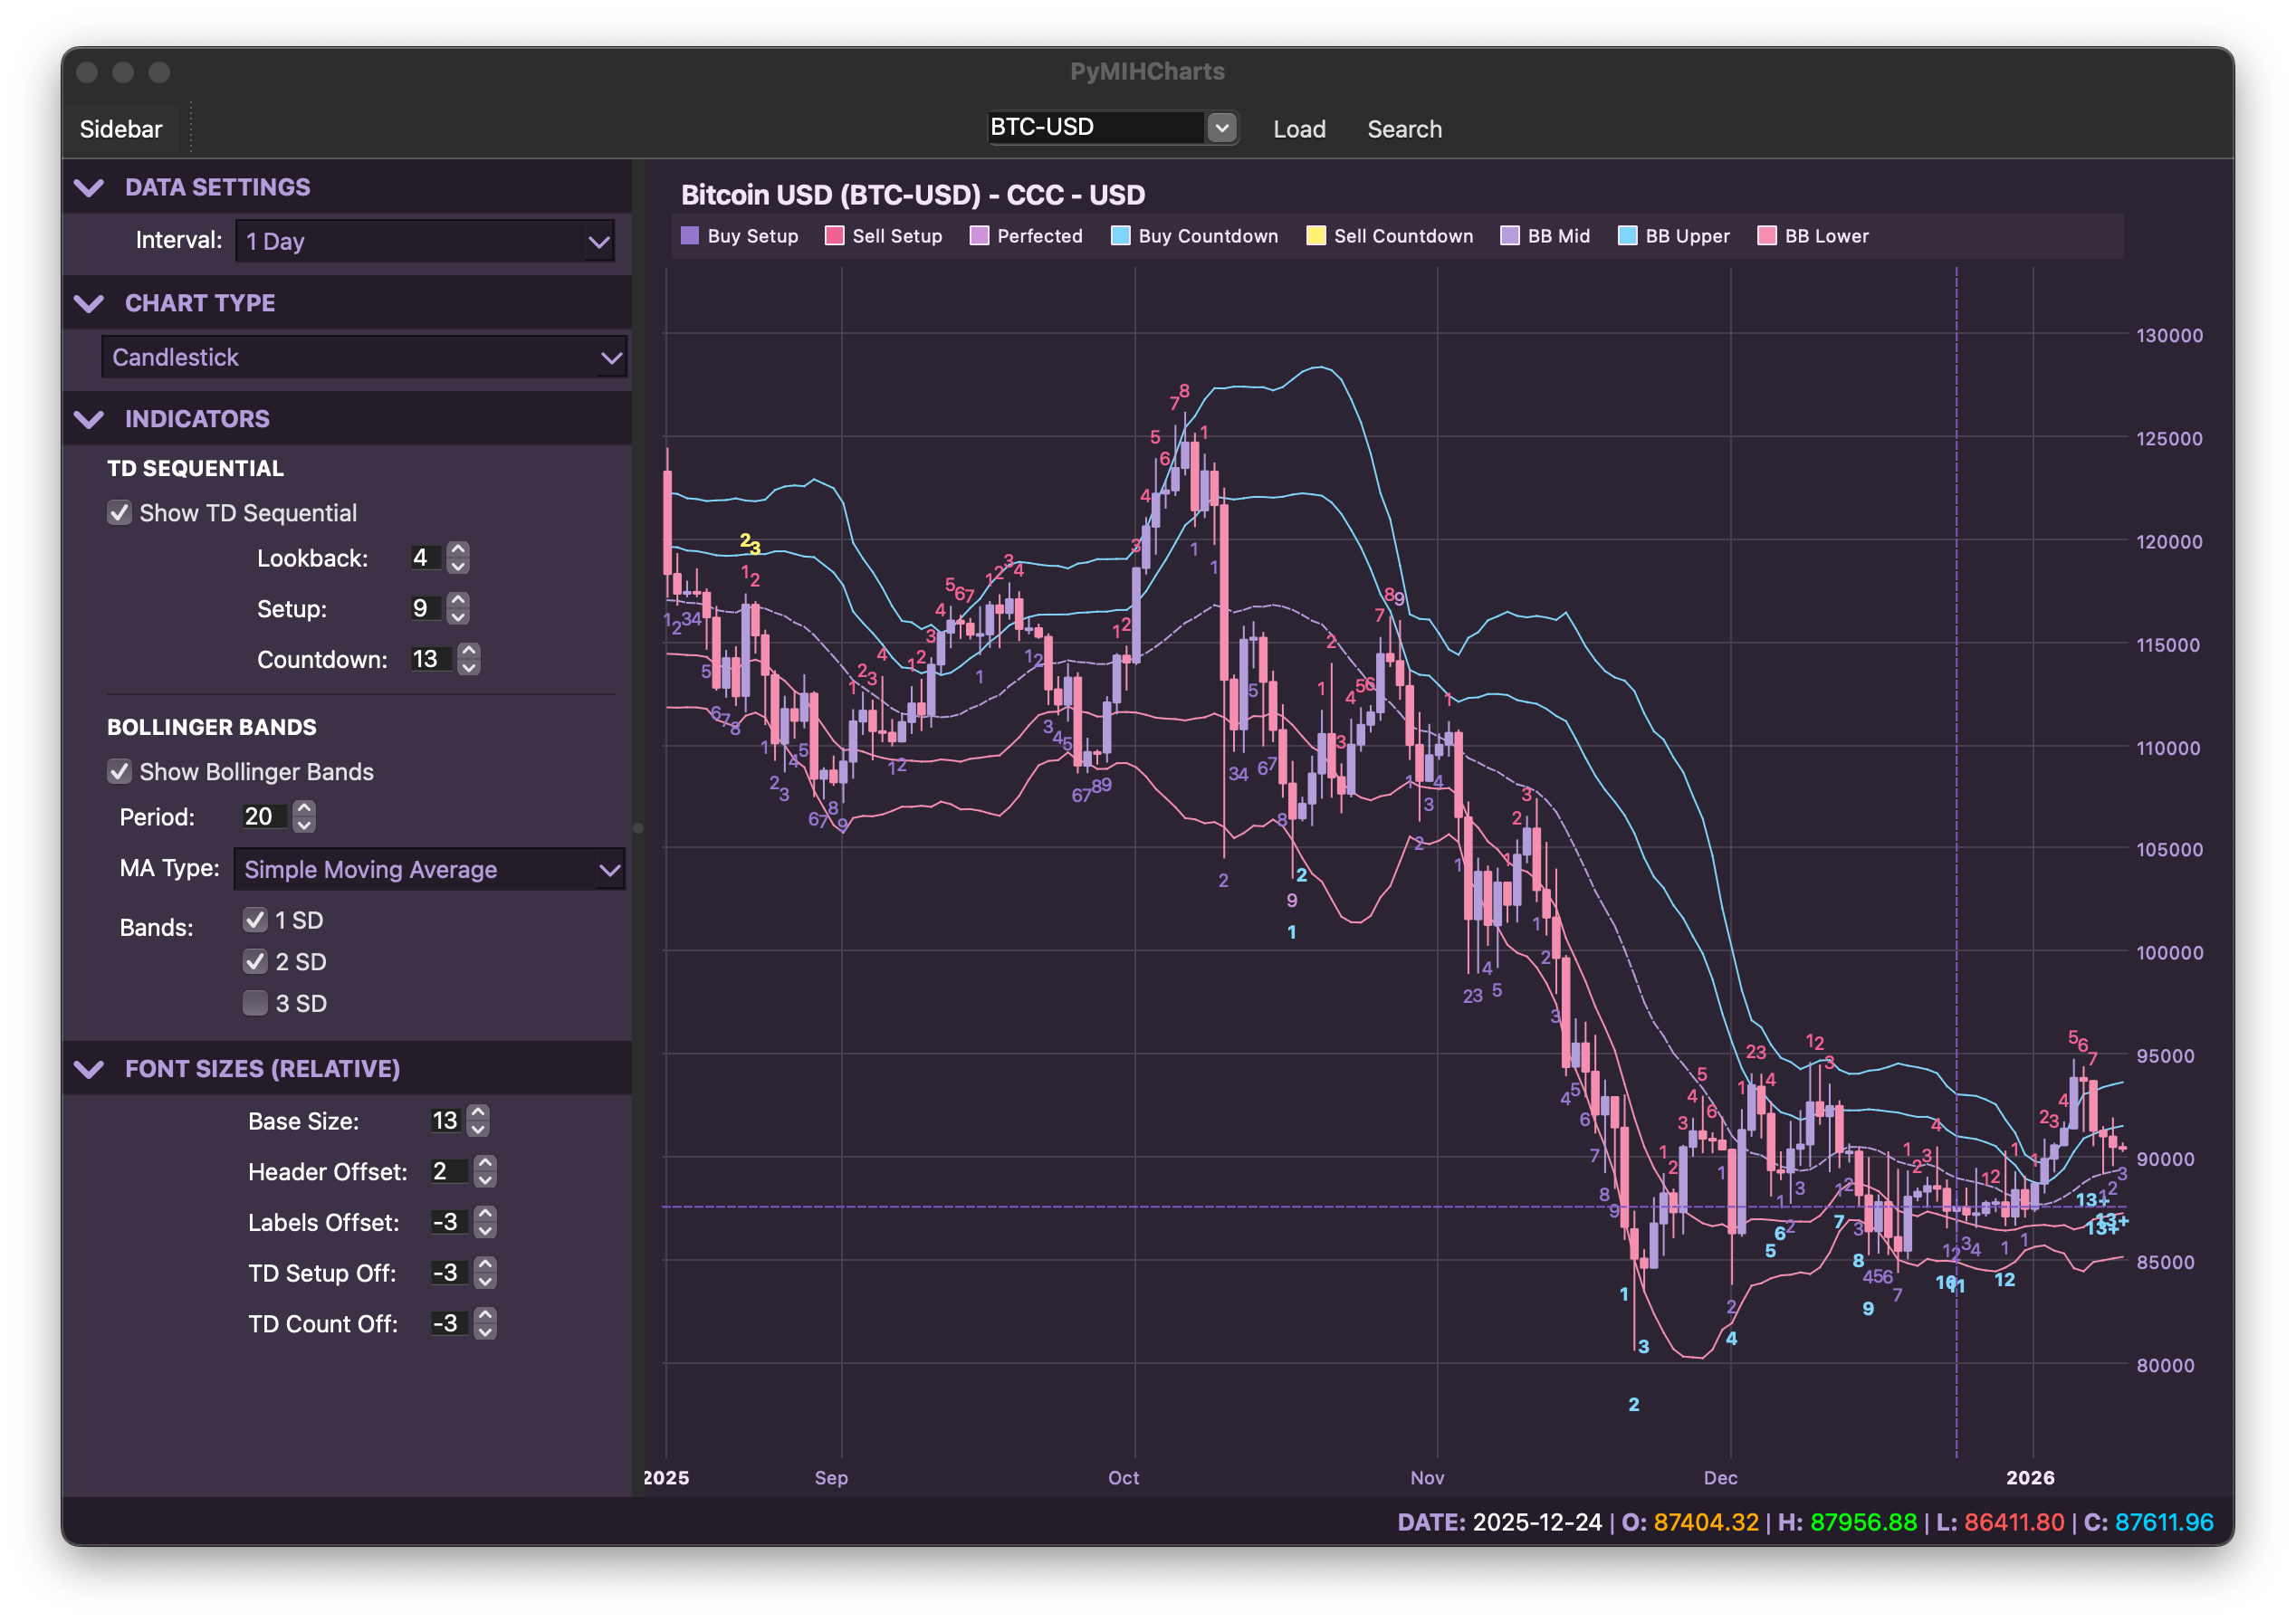
PyMIHCharts is a Python desktop application designed for technical analysis, specifically focusing on Tom DeMark’s TD Sequential indicator.
Instead of relying on web-based wrappers, this application uses PySide6 and a custom-built rendering engine using QPainter. This ensures buttery-smooth navigation, pinch-to-zoom, and precise pixel-perfect rendering of complex chart elements.
Key Features
- Deep TD Sequential Implementation: It’s not just a basic counter. It handles Price Flips, Setup (1-9), Setup Perfection (highlighted in Magenta), TDST levels, and the full Countdown (1-13).
- Professional Rendering: The “Professional Charting Engine” features smart crosshairs, adaptive date axes, and a “Nice Number” algorithm for the price axis.
- Interactive UI: Seamless navigation with mouse and touch gestures.
- Integrated Data: Automatically fetches historical daily data using
yfinance, so you can start analyzing stocks right away.
Why Build This?
Building a charting engine from scratch is a fantastic challenge in optimization and UI design. It allowed me to explore:
- High-performance graphics with Qt.
- Complex logic implementation for financial indicators.
- Data handling for time-series financial data.
What’s Next?
This is just the beginning. I intend to add more technical analysis indicators—covering both common standards as well as some less common, specialized tools—in the near future to make this a truly comprehensive analysis platform.
Try It Out
The project is open-source and available on GitHub. I’d love for you to give it a spin, check out the code, and let me know what you think!